Cost Tree: Azure and AWS Spend Changes
Overview
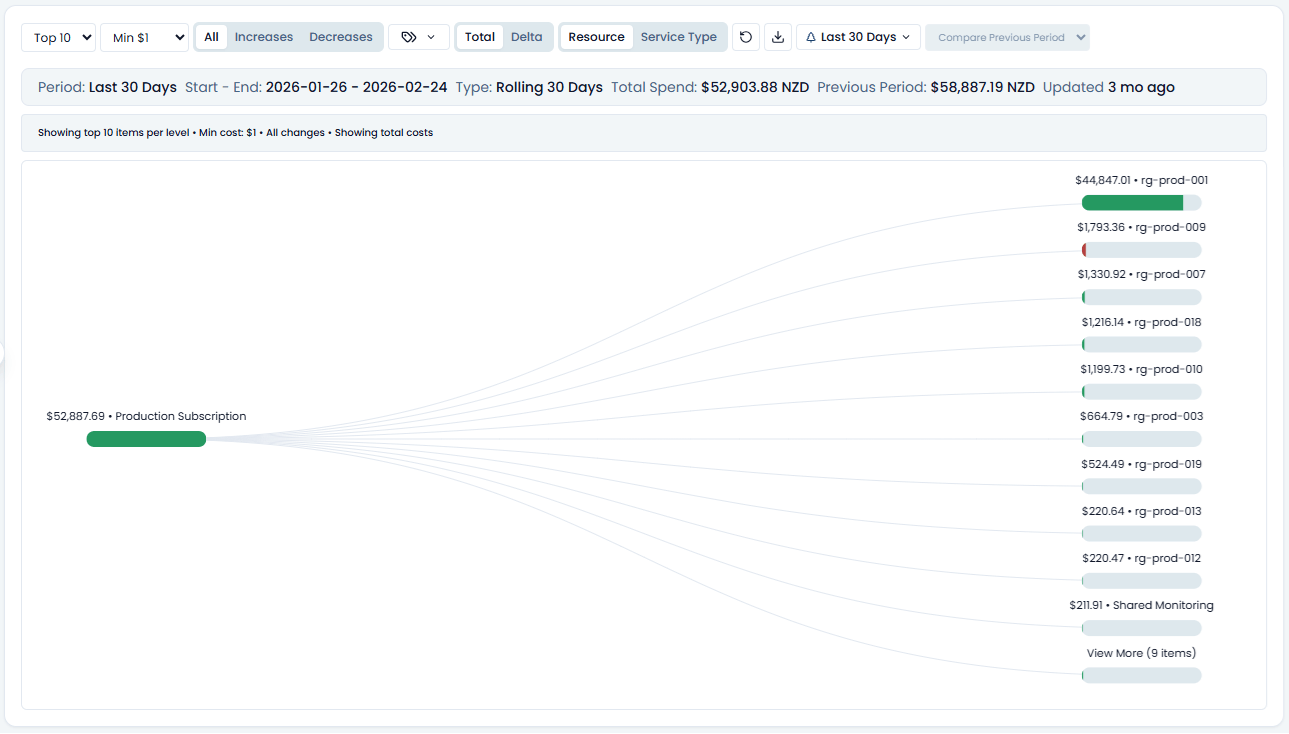
Spotto Cost Tree is a hierarchical cloud cost breakdown for answering a simple but awkward question: where did the spend go, and what changed? Azure billing follows subscription, resource group, service, and resource paths. AWS billing follows account, service, Region, and resource paths, with meter detail where available.
You may also see it described as a billing tree or cost decomposition tree. The intent is the same: turn a large billing export into an investigation surface that is easier to scan than a spreadsheet.
What Cost Tree helps you answer
- Which subscriptions, resource groups, services, meters, and resources are driving spend?
- What changed between this period and another period?
- Was the change an increase, a decrease, or a mix of both?
- Which tags, teams, departments, products, or environments own the spend?
- Which changed items deserve deeper investigation in resource details or Cost Analysis?
Cost Tree is built for investigation. Your cloud provider's billing data remains the source of truth; Cost Tree is the map you use when the bill has too many roads.
Missing or non-finite headline spend is shown as Unavailable. A measured zero remains zero, credits keep their negative sign, and an absent currency is not replaced with a guessed currency. Where the published values include a configured discount, open After …% configured discount to review its coverage. The page displays those published amounts without applying the discount again; partially verified charge sources can leave individual values unavailable.
Turn cost attribution into a decision
Select Business Value beside Notes, search, and the subscription selector. The brief uses available cost snapshots, subscription coverage, and currency-safe 30-day scope evidence to frame an owned cost-control decision.
Generate tailors only the narrative for permitted users and saves it to the exact scope. Clear removes that saved narrative and immediately restores the standard Business Value content without deleting Customer Context or changing live facts. Regenerate when evidence changes. Above 100 subscriptions, the curated live brief remains available without tailoring.
Use it to:
- validate the largest current and changed cost drivers and decide whether to optimize, accept, or monitor them
- assign each material driver to a product, team, or cost centre
- approve mandatory allocation tags such as product, cost centre, team, environment, and owner
- confirm or configure Spotto budget and anomaly alerts so material movement reaches the responsible owner early
Poorly tagged or unowned spend remains difficult to allocate, challenge, and optimize. Multiple currencies are shown separately rather than summed, and the presence of tag keys does not prove complete resource coverage.
Where to find it
In the Spotto Portal, open your company and navigate to Investigate -> Cost -> Cost Tree.
Key workflows
Use these pages when you want a deeper guide for a specific task.
| Task | Use this page |
|---|---|
| Compare a bad month with a good baseline month | Comparing periods |
| Compare one day with another day | Comparing periods |
| Understand red/green deltas and largest movers | Delta mode |
| Explain what drove the change with the answer panel and Sankey | Change Drivers |
| Reduce noise with search, tags, virtual tags, service type, resource group, grouping, and thresholds | Filtering and grouping |
| Review recent cost-related activity for a resource | Drill into a node |
Core concepts
Period selection
Cost Tree supports rolling periods, calendar months, daily calendar snapshots, and billing periods.
- Rolling periods, such as Last 30 Days, are best for quick operational checks.
- Calendar months are best for month-to-month analysis.
- Daily calendar snapshots are best when a dashboard spike points to a specific day in the last 30 days.
- Billing periods are best when you want to line up with invoice windows.
Total vs Delta
- Total shows where the money is going in the selected period.
- Delta shows what changed compared with another period.
Delta mode is the better starting point when someone asks, "Why did this move?" Total mode is the better starting point when someone asks, "What is expensive right now?"
Previous vs custom comparison
Cost Tree can compare the selected period with its immediate previous period, or with a specific calendar month, daily snapshot, or billing period. Custom comparison is useful when the previous period was noisy and you want to compare against a known-good baseline.
For daily snapshots, Cost Tree defaults to comparing the selected day with the previous available day. Use the comparison calendar when you want to compare with another day from the rolling 30-day daily history.
See Comparing periods for examples, including how to compare a bad month with a good month.
Change Drivers
When Delta mode is active, Change Drivers gives you a summarized explanation view. It ranks the largest increases and decreases, explains offsetting movement, and shows a Sankey diagram built from delta contribution rather than total cost.
Use it when you want the short version of the story before you drill back into the detailed tree.
See Change Drivers for how to read the answer panel and Sankey.
Drill into a node
Click a node in the tree to open the investigation panel. Depending on the selected node and available data, the panel can show:
- current cost, previous cost, and change
- billed and amortized cost
- percent of total
- resource and Spotto tags
- change analysis reasons such as usage, rate, SKU or meter changes, new meters, removed meters, or new resources
- recent cost-related Azure activity when the node maps to a resource, including who made the change and when
- links into resource details when the node maps to an Azure resource
The Changes tab includes Recent Activities for resource-level nodes when activity data is available. Spotto focuses this list on cost-relevant actions, such as create, update, scale, SKU, configuration, or delete events, and suppresses noisy operational events that rarely explain spend movement, such as key listing. The panel shows the most recent activity first and lets you open the full list when more events are available.
AWS change details
For AWS nodes with comparison evidence, open Changes, then More Info to review the billed spend movement. Explanations distinguish usage changes, effective billed-rate changes, newly billed or disappearing charges, and changes in credits, fees or commitment-related charges. AWS spend excludes tax, like Azure; your AWS invoice can include tax. Usage explanations retain their billing unit, such as broker hours or requests. An effective billed-rate change can reflect discounts or coverage; it does not establish an AWS price-list change.
A charge appearing or disappearing does not by itself prove that a resource was created or deleted. Some AWS charges have no individual resource identity, and smaller entries may be combined into Other groups. Billing explanations can still be available when resource inventory details are unavailable.
If More Info is absent, the selected node may lack comparison history or retained change detail. Older AWS trees need to be regenerated from the collected billing data before the explanations appear; granting additional AWS permissions is not required when that data is already present.
Cost source confidence
Some periods include a mix of billed and estimated spend. Cost Tree shows cost source signals so you can see whether a number is billed, estimated, or mixed.
- Billed: spend from provider billing data.
- Estimated: spend estimated while billed detail is delayed or incomplete.
- Mixed: billed and estimated spend appear in the same period.
Use this as a confidence signal. It is fine to investigate early, but final month-end explanations should be checked once billed data is complete.
For a broader explanation of actual, retail, estimated, and blended pricing, see the Pricing FAQ.
Technical reference
| Component | Details |
|---|---|
| Inputs | Precomputed billing tree snapshots, resource metadata, tags, Spotto tags, change-analysis signals, and resource activity data where available. |
| Outputs | Interactive Cost Tree, Delta view, Change Drivers view, per-node cost summary, tags, change-analysis details, and recent resource activity. |
| Defaults | Last 30 Days when available, Top 10 items per level, and a small minimum-cost threshold to reduce noise. |
How it differs from Azure-native cost views
Azure Cost Management is the system of record for billing. Cost Tree is tuned for investigation:
- It makes deltas first-class so the biggest movers surface quickly.
- It supports comparing specific months or billing periods, not only "this vs last."
- It keeps cost, tags, Spotto tags, resource context, and change reasons together.
- It lets teams slice spend by the ownership model they actually use, such as product, department, environment, region, or service owner.
Limitations
- Not real-time: costs update after billing data syncs, and provider billing data can lag.
- Custom comparison is not available for rolling periods: use calendar months, daily calendar snapshots, or billing periods when you need a specific comparison period.
- Daily Cost Tree history is rolling: daily calendar snapshots cover the last 30 days when those files are available.
- Recent activity is supporting context: activity logs can help explain a resource-level change, but not every cost movement has a matching activity event.
- Multi-subscription comparisons require common periods: if one selected subscription is missing a period, that period is not offered for the group view.
- Desktop only: Cost Tree is designed for wide investigation screens.
Troubleshooting
No data or an empty Cost Tree
What you're seeing: the page shows a no-data state or an empty chart.
Likely causes:
- The subscription has not completed billing sync yet.
- The selected subscriptions have no common period snapshots.
- Azure Usage cost visibility may not be enabled for a CSP Microsoft Azure Plan or MCA subscription.
How to fix:
- Confirm the subscription is marked ready or synced in Spotto.
- Try a different period, such as Last 30 Days or a recent calendar month.
- If multiple subscriptions are selected, switch to a single subscription to confirm data exists.
- For CSP subscriptions, review Azure Cloud Account billing prerequisites.
Custom comparison keeps resetting
What you're seeing: your comparison selection switches back to previous.
Likely causes:
- You changed to a rolling period, which does not support custom comparison.
- The chosen comparison period is not available for the current subscription selection.
How to fix:
- Select a calendar month, daily calendar snapshot, or billing period.
- If multiple subscriptions are selected, pick a comparison period that exists for all selected subscriptions.
Tag filters do not show the rollup you expected
What you're seeing: a tag filter returns no rows, or the rollup does not match the business owner you expected.
Likely causes:
- Cloud tags differ across subscriptions or teams.
- The tag value does not exist in the selected period.
- The business grouping you need is not represented in Azure tags.
How to fix:
- Clear the filter and reapply one tag at a time.
- Check for naming differences such as
Env: prodvsEnvironment: Production. - Use Spotto tagging to create virtual tags for product, department, owner, region, or cost center rollups.
Looking to enhance your cloud setup for cost efficiency, performance, reliability, or security?
Talk to a cloud specialist. Email us or schedule a 30-minute consultation and let's optimize your cloud environment together.
Book a Free Consultation