Cost Tree: Find Azure Spend Change Drivers
Overview
Change Drivers is a Delta-only Cost Tree view that explains the biggest period-over-period movements. It combines a ranked answer panel with a Sankey diagram so you can see both the written explanation and the visual flow of change.
Use it when you want the executive summary before drilling into the full Delta tree.
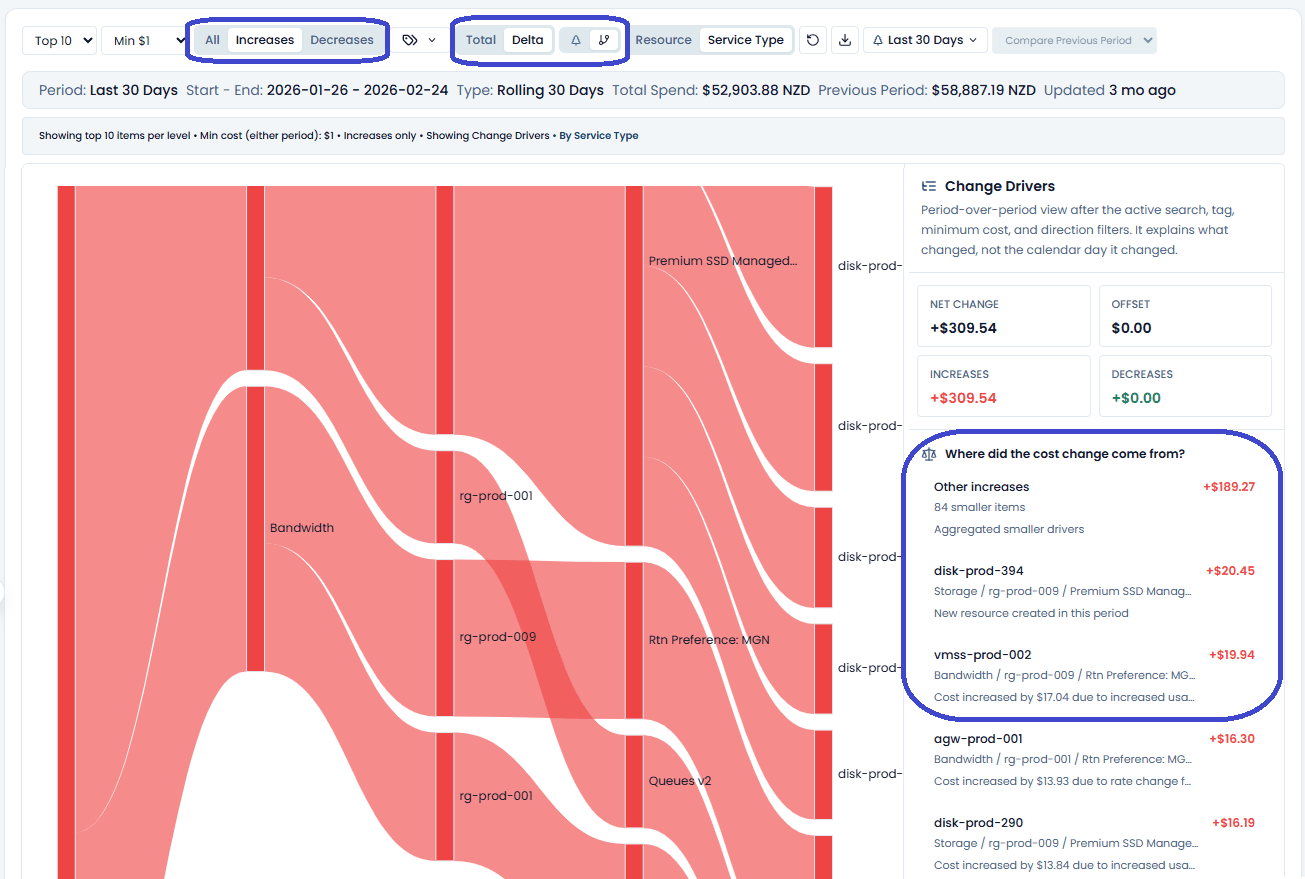
What Change Drivers answers
Change Drivers is designed around four investigation questions:
- Where did the cost change come from?
- Which resource groups, services, meters, and resources contributed most?
- Was the net change driven by usage, rate, SKU or meter changes, new resources, or removed meters?
- Which increases were offset by decreases?
The view is built from the currently processed Cost Tree. Active search, tag, minimum cost, grouping, and direction filters shape the data before the top drivers are ranked.
Read the summary
The summary cards show:
- Net change: total selected-period change after active filters.
- Increases: total positive movement.
- Decreases: total negative movement.
- Offset: the amount of increases cancelled out by decreases.
Offset is calculated as the smaller of total increases and absolute total decreases. For example, if increases add $1,000 and decreases remove $300, then $300 of the increases were offset. The net change is still +$700.
Read the ranked rows
The answer panel shows top increases and top decreases. By default, the view keeps the largest visible drivers and rolls smaller items into Other increases and Other decreases buckets when needed.
Each driver row can include:
- the node name
- the visible tree path
- the signed cost change
- a reason summary when change-analysis metadata is available
- whether the row is an aggregate "Other" bucket
Click a row to focus the Sankey on that driver. Click more rows to focus on a small set of drivers. Clear the Sankey filter to return to the full driver view.
Read the Sankey diagram
The Sankey is a delta-contribution visual, not a total-cost flow diagram.
- Wider links mean larger absolute cost movement.
- Increase links represent positive movement.
- Decrease links represent negative movement.
- The chart carries sign separately because Sankey values cannot be negative.
- Hovering or selecting rows and chart items links the answer panel and the visual.
This is useful for seeing the path from the Cost Tree root through the hierarchy to the driver. It is not meant to replace the full tree when you need every detail.
Filter Change Drivers
Change Drivers honors the same investigation scope as Cost Tree:
- search terms
- tag filters
- Spotto virtual tags
- grouping
- minimum cost threshold
- increases-only or decreases-only filters
The summary cards for Increases and Decreases can also filter the Sankey without changing the underlying Cost Tree filters.
Reason metadata
Reason rollups summarize available change-analysis reasons across the visible drivers. Common reason types include:
- usage increases or decreases
- rate changes
- SKU or meter changes
- new resources or meters
- removed resources or meters
If a row says reason metadata is not available, the cost movement is still real. It only means the current data does not have enough structured context to explain why beyond the period-level cost change.
What Change Drivers cannot answer
Change Drivers explains what changed between periods. It does not explain the exact calendar day the change started.
It also does not join deployment history, activity logs, ticket changes, or incident timelines. For that level of timing and cause analysis, use daily Cost Analysis views, resource details, and operational history alongside Cost Tree.
When to use the Delta tree instead
Use the full Delta mode tree when:
- you need a complete hierarchy, not just top drivers
- you want to inspect every nested resource or meter
- an "Other" bucket needs deeper drilldown
- you need to open resource details or review node-level tags