Cost Analysis: Forecast and Cost Anomalies
Overview
Cost Analysis answers the recurring question: "Is this spend change real, and what caused it?" It charts published Azure subscription and AWS account costs, explains observed unusual usage and service drivers, and shows a projection when the evidence supports it. Read the cost basis and coverage before comparing figures.
In the Spotto Portal, open your company and go to Investigate -> Cost -> Cost Analysis.
AWS usage and projection coverage
AWS charts identify billed or amortized spend and exclude tax, like Azure. Your AWS invoice can include tax. Recorded costs can include credits or periodic fees, while an assessment marked recorded usage excludes periodic charges from usage anomaly detection. A large periodic-charge bar is therefore not automatically a usage anomaly.
Anomaly detection unavailable means the required assessment did not complete. It does not establish normal spend. Recorded charts can remain visible while assessment is unavailable. Projection unavailable explains why a complete account projection has not been produced; periodic charges or unsuitable billing evidence can prevent it. Focus forecast is enabled only when a projection exists. CSV and Word exports retain the basis and these limitations; an incomplete assessment is shown as Unassessed.
When resource detail is available, anomaly drivers list recorded resource IDs and their observed costs. A listed ID does not establish a current inventory match. Resource comparisons use the preceding seven calendar days; limited recorded history leaves the baseline and change unavailable. Missing IDs or bounded detail collection can leave attribution partial, so the listed resources must not be treated as the whole anomaly impact. Those qualifications also appear in CSV and Word exports.
If these views are missing or remain unavailable, confirm account access and billing setup with your administrator. Some older source data needs controlled regeneration; rebuilding a view alone does not create new billing evidence. See AWS billing sources and AWS read permissions.
How to read it
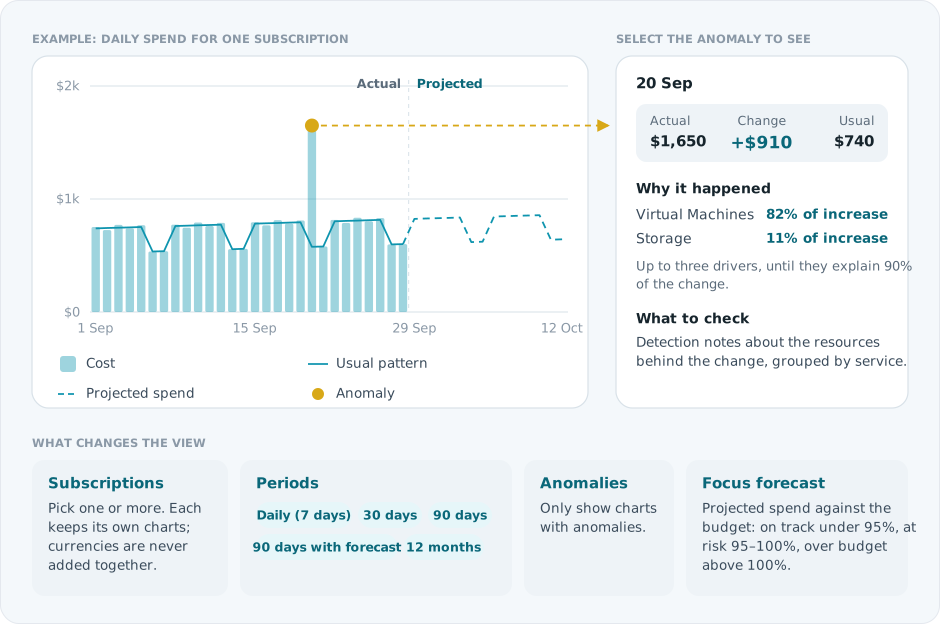
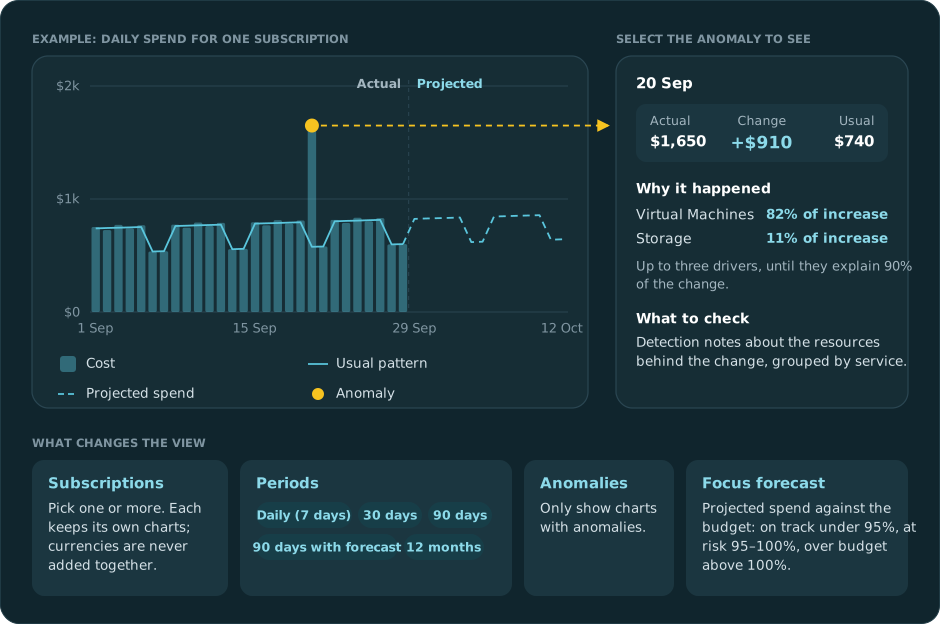
- Charts show daily spend or monthly spend. On a monthly chart the current month is marked as month to date.
- The forecast chart also draws Expected spend, the model's fit over past days, so you can see how well the projection tracks reality.
- Each subscription card also shows Unusual days, last 7 days and Spend, last 30 days.
- Anomalies are tied to the chart's date range. A card with anomalies shows View N anomalies; select it, or the chart, to open the details.
- Detection uses several methods rather than a single threshold. A driver list only appears when the billing data can attribute the change to services or resources.
Turn cost evidence into a decision
Select Business Value beside Notes, the filters, and the subscription selector. The brief combines loaded-scope coverage, recent anomalies, 30-day spend, and forecast availability without combining currencies into an unsafe total.
Generate tailors only the narrative for permitted users and saves it to the exact scope. Clear removes that saved narrative and immediately restores the standard Business Value content without deleting Customer Context or changing live facts. Regenerate when evidence changes. Above 100 subscriptions, the curated live brief remains available without tailoring.
Use it to agree:
- which anomalies or sustained movements need investigation now
- the budget, forecast-variance, or daily anomaly thresholds that require action
- the Spotto cost alerts, notification destinations, triage owner, and response cadence that provide early detection
Unexplained movement can continue compounding until routine billing review. The brief therefore asks for an owned intervention before month-end, while treating forecasts and anomaly signals as evidence to validate rather than invoice guarantees.
Export
Export sits next to Business Value:
- Data (CSV): the chart points for the active period filters, plus anomaly evidence and notes.
- Report (Word): a FinOps report with an executive summary, monthly cost, month-to-date and forecast evidence, anomaly windows, recurring drivers and suggested investigations.
Exports use every successfully loaded subscription you selected and keep currencies separate.
How it differs from Azure-native cost views
Azure Cost Management is the source of truth for billing data and is built for reporting and exploration. Cost Analysis is built for investigation: fixed time windows, a forecast, and anomalies explained against usual spend with their drivers. When you need resource- or tag-level detail, continue in Cost Tree or Resources.
Limitations
- Not real-time: charts update after billing data syncs, and provider billing data can lag by days.
- Forecasts are directional: use them for planning and trend checks, not precise accounting.
- Anomaly detection is probabilistic: a person should confirm anything expensive.
For details on actual, retail, estimated, and blended pricing, see the Pricing FAQ.
Troubleshooting
"We don't have cost analysis for this subscription yet"
Likely causes: the subscription hasn't completed its first billing sync, or Azure billing export isn't connected.
How to fix:
- Confirm the subscription is connected and syncing in Spotto, and that billing export is connected.
- Wait for the next billing sync and retry.
- If it persists, capture the subscription ID and contact support.
"We couldn't load cost analysis data"
Likely causes: a temporary service issue, or the subscription isn't accessible in your current company context.
How to fix: select the subscription again, then use Try again. If it continues, capture the error text and time and contact support.
"Billing data may be out of date" or "Showing the last successfully processed billing data"
The charts are usable but may not include the latest sync. The callout says the date billing data is available through. Refresh after the next sync completes.
"Billing data is unavailable" or "Cost analysis is temporarily unavailable"
Spotto couldn't verify the latest billing analysis, so it hides the charts and anomalies rather than showing incomplete data. Wait for the retry countdown, then try again. If it continues after the next cloud sync, rerun the sync or contact your Spotto administrator. Other selected subscriptions still show their charts.
"No billing activity in the checked scope"
Spotto found no cost activity for the subscription, so it doesn't draw zero-value charts.
"We don't have chart data yet" or "We couldn't load this chart"
One chart isn't ready or failed to load. Use Retry chart, or check the other periods; they can become available at different times.
"No unusual spend detected for this period"
Nothing in that period moved far enough from usual spend. Check a longer period to see whether the change is gradual, or use Cost Tree to see whether a service or resource changed without triggering an anomaly.
For AWS No unusual usage spend, this statement applies to the completed recorded-usage assessment. Periodic charges can still change the displayed spend. Anomaly detection unavailable is a different state and does not establish normal usage.
Looking to enhance your cloud setup for cost efficiency, performance, reliability, or security?
Talk to a cloud specialist. Email us or schedule a 30-minute consultation and let's optimize your cloud environment together.
Book a Free Consultation