Resource Cost Timeline: Read Usage and Estimates
Overview
Resource Cost Usage Timeline in Spotto shows how each cost item evolves over time for a single resource. It is designed for questions like:
- “When did this SKU or tier change?”
- “Which items are billed already, and which items are still estimated?”
- “Is this item current, historical, or inactive?”
Instead of collapsing everything into a single number, the timeline keeps time windows visible, so replacement cutovers and estimated tails are obvious.
Why use this?
Common pains
- A single 30-day spend total hides when a cost item changed.
- Replaced or historical items can be hard to distinguish from current items when you only look at rows and amounts.
- Estimated spend is useful, but teams need to see where it starts and stops relative to billed coverage.
What you gain
- A direct view of billed, estimated, and historical/inactive windows.
- A better way to validate mid-month changes such as tier, SKU, or storage plan replacements.
- Faster understanding of whether a cost item is still active, already billed, or only present as a short estimated tail.
Example
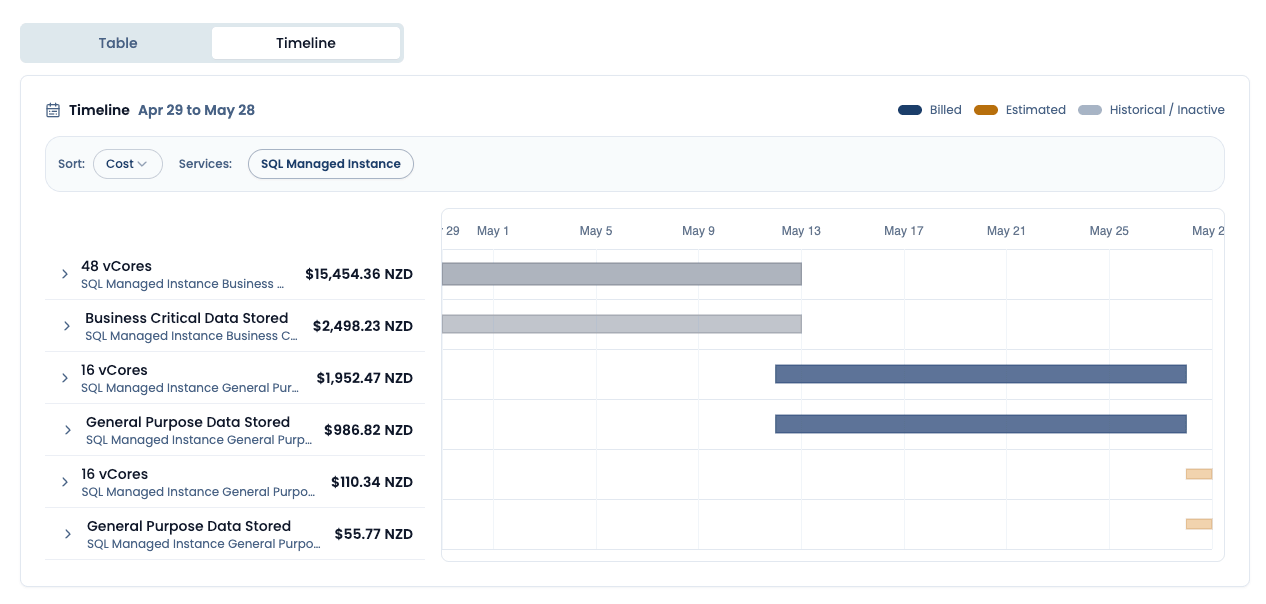
Use this view when a resource changed configuration mid-month and you need to confirm that the old cost items stopped and the new ones began at the expected point in time.
How to read the timeline
- Left side: the item list shows the cost items and their 30-day amounts.
- Right side: each bar shows the dates where that item is present.
- Blue means billed.
- Orange means estimated.
- Gray means historical / inactive.
This is especially helpful when the same resource moves from one pricing setup to another, such as:
- a SQL Managed Instance tier change
- a managed disk pricing configuration change
- a storage account component that becomes historical while a new component becomes current
Filters and sort
The timeline includes:
- Sort: default or cost-based ordering
- Services: pill filters to focus the chart on one or more service groups
These controls help when a resource has many cost items and you only want to inspect one service family or prioritize the most expensive rows first.
Tooltip behavior
Hover a bar to inspect:
- the cost item name
- service family
- exact date or date range
- cost item state (
Billed,Estimated, orHistorical / Inactive) - the 30-day amount for that row
The timeline tooltip is intentionally separate from the table rows so the chart can stay readable without overloading every line with state tags.
When to use it vs. the table view
Use Table when you need:
- pricing details
- recommendation-linked savings context
- current vs target plan comparisons
Use Timeline when you need:
- temporal sequencing
- billed coverage boundaries
- estimated tails
- replacement timing
Technical reference
| Component | Details |
|---|---|
| Inputs | Resource cost history, billed and estimated coverage, and cost item state for the selected resource. |
| Outputs | Item list + timeline view with billed, estimated, and historical/inactive bars. |
| Defaults | Default sort is cost-descending. Historical and inactive states share a single gray timeline language to reduce chart noise. |
Troubleshooting
I only see billed rows and no estimated bars
What you’re seeing: The timeline contains only blue bars. Likely cause: The current period is fully covered by billed data. What to do: This usually means estimation is not needed for that resource window.
I see short orange bars at the end of the month
What you’re seeing: A small estimated tail appears after billed coverage. Likely cause: Provider billed data has not landed for the latest days yet. What to do: Use the banner above the chart to confirm how much of spend is estimated vs billed.
I see gray bars for old items
What you’re seeing: Historical items remain visible even though they are no longer current. Likely cause: The timeline intentionally preserves historical windows so you can understand the replacement sequence. What to do: Use the gray bars as context; current items are the non-gray rows that continue into the latest window.
Looking to enhance your cloud setup for cost efficiency, performance, reliability, or security?
Talk to a cloud specialist. Email us or schedule a 30-minute consultation and let's optimize your cloud environment together.
Book a Free Consultation